In the comments to the entry titled The Boxing Day Shooting, an anonymous commenter pointed me to a Globe and Mail article, Do We Need a Boston Miracle?
The article ends with a table of the murder rates for a number of North American cities. Before I show it to you, let me first explain what is meant by the term “murder rate”.
“Murder Rate” Does Not Mean “Number of Murders”!
Many people misuse the term “murder rate” or “homicide rate” — they often use it when speaking of the number of people who have been murdered. The word rate implies a ratio, which is a mathematical term for a relationship between at least two numbers. For example, let’s take the recipe for one of the simplest cocktails out there: the screwdriver. Most bartender’s manuals recommend 2-to-1 ratio of orange juice to vodka, which means that for every 2 ounces of orange juice, you use 1 once of vodka. Want to use up a 10-ounce can of orange juice? Then you need 5 ounces of vodka handy. Got a pint of vodka? Then you’ll need a quart of OJ. Want a stiffer drink? Change the ratio of orange juice to vodka to 1-to-1. Want something a little less boozy? Make the ratio 3-to-1.
The murder rate is also a ratio: it’s a ratio of the number of murders in a given area to the population of that area. This number is a little more meaningful than just the number of murders in an area alone. Think about it this way: suppose a village of 500 people experiences 50 murders in a year. That’s a big chunk of the village: the ratio of murdered people to population is 1 to 10, which can also be expressed as “1:10” or “10 percent”. You could rightfully claim that the town has been decimated (the colloquial use of the term “decimated” is “killed a substantial amount”; the original meaning was “killed one-tenth”). Now imagine a city of 5 million people experiencing 50 murders in a year. That city’s ratio of people murdered to population rate is 1 to 100,000, or “1:100,000” or “one-thousandth of one percent”.
Since murder ratios (as well as other crime rates) are typically small numbers — usually some teeny fraction of one percent — they are typically expressed in terms of murders per 100,000 people; this is called the murder rate. The city of 5 million with 50 murders in a year that I mentioned in the previous paragraph has a murder rate of 1 (that is, one person for every 100,000 was murdered). The village of 500 with the same number of murders has a murder rate of 10,000!
Recent Murder Rates
United States
To give you an idea of what murder rate numbers are typically like, take a look at this table of murder rates in the US spanning the years 2001 through 2004 (taken from this page). Remember, this is a chart of murder rates, meaning that the numbers here are murders per 100,000 people.
Table 1: Murder Rates for Various Regions in the U.S., 2001 – 2004
| Region | 2001 | 2002 | 2003 | 2004 |
|---|---|---|---|---|
| South | 6.7 | 6.8 | 6.9 | 6.6 |
| West | 5.5 | 5.7 | 5.7 | 5.7 |
| Midwest | 5.3 | 5.1 | 4.9 | 4.7 |
| Northeast | 4.2 | 4.1 | 4.2 | 4.2 |
| National average | 5.6 | 5.6 | 5.7 | 5.8 |
A little quick mental math reveals that the average murder rate for the entire United States for this period is 5.6.
Canada
Let’s look at the murder rates for the provinces and territories of Canada for the years 2000 through 2004 (data from Statistics Canada):
Table 2: Murder Rates for Provinces and Territories in Canada, 2000 – 2004
| Province/Territory | 2000 | 2001 | 2002 | 2003 | 2004 |
|---|---|---|---|---|---|
| murders per 100,000 population | |||||
| Canada | 1.78 | 1.78 | 1.86 | 1.73 | 1.95 |
| Newfoundland and Labrador | 1.14 | 0.19 | 0.39 | 0.96 | 0.39 |
| Prince Edward Island | 2.20 | 1.46 | 0.73 | 0.73 | 0.00 |
| Nova Scotia | 1.61 | 0.97 | 0.96 | 0.85 | 1.39 |
| New Brunswick | 1.33 | 1.07 | 1.20 | 1.07 | 0.93 |
| Quebec | 2.04 | 1.89 | 1.58 | 1.32 | 1.47 |
| Ontario | 1.34 | 1.43 | 1.47 | 1.45 | 1.51 |
| Manitoba | 2.61 | 2.95 | 3.12 | 3.70 | 4.27 |
| Saskatchewan | 2.58 | 2.70 | 2.71 | 4.12 | 3.92 |
| Alberta | 1.96 | 2.29 | 2.25 | 2.03 | 2.69 |
| British Columbia | 2.10 | 2.06 | 3.06 | 2.26 | 2.67 |
| Yukon Territory | 6.57 | 3.32 | 0.00 | 3.27 | 22.43 |
| Northwest Territories | 2.47 | 9.80 | 9.64 | 9.48 | 9.34 |
| Nunavut | 10.91 | 10.67 | 6.96 | 10.29 | 13.49 |
Wow — when people said that it was cold in the Territories, I thought they were only talking about the temperature! More quick math reveals that the average murder rate across Canada for this period is 1.82.
The World’s Most Murderous Places
Let’s go outside the relatively safe bubble of North America and look at the ten countries with the highest murder rates in the period spanning 1998 – 2000 (data from NationMaster.com, which got its info from the 7th United Nations Survey of Crime Trends and Operations of Criminal Justice Systems):
Table 3: Murder Rates in the Top Ten Countries, 1998 – 2000
| Country | Murder Rate (Murders per 100,000 population) |
|---|---|
| Colombia | 61.8 |
| South Africa | 49.6 |
| Jamaica | 32.4 |
| Venezuela | 31.6 |
| Russia | 20.1 |
| Mexico | 13.0 |
| Estonia | 10.7 |
| Latvia | 10.4 |
| Lithuania | 10.3 |
| Belarus | 9.8 |
2004 Murder Rates for Various North American Cities
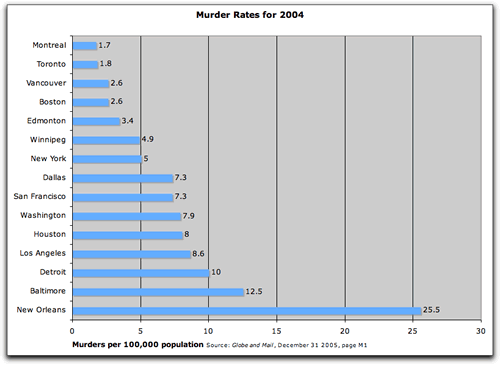
Here are the 2004 murder rates for various American and Canadian cities, a listed in the Globe and Mail article. I’ve highlighted Toronto in red.
Table 4: Murder Rates for Various North American Cities, 2004
| City | 2004 Murder Rate (Murders per 100,000 population) |
|---|---|
| Montreal | 1.7 |
| Toronto | 1.8 |
| Vancouver | 2.6 |
| Boston | 2.6 |
| Edmonton | 3.4 |
| Winnipeg | 4.9 |
| New York | 5 |
| Dallas | 7.3 |
| San Francisco | 7.3 |
| Washington | 7.9 |
| Houston | 8.0 |
| Los Angeles | 8.6 |
| Detroit | 10.0 |
| Baltimore | 12.5 |
| New Orleans | 25.5 |
A minute’s worth of spreadsheet work makes this data easier to visualize (click the graph below to see it at full size):
Graph 1: Murder Rates for Various North American Cities, 2004
I’ve got to get to work, so I’ll stop here and write more later. In the meantime, if you’ve got anything to say about these statistics or the current situation in Toronto, please feel free to do so in the comments.


 I haven’t yet seen
