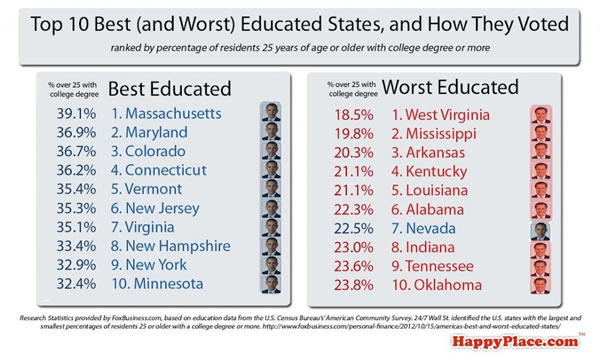
In today’s mailing from someecards, I got pointed to HappyPlace.com’s table showing the US’ ten best- and worst-educated states and how they voted, and surprise, surpise: there’s a pattern!
Table from HappyPlace.com, using data from FoxBusiness.com. Ouch. Click to see the source.
The table takes its data from, of all places, an October 15th, 2012 Fox Business article which in turn got its information from an October 15th, 2012 article in 24/7 Wall Street, which in turn got its information from the U.S. Census Bureau’s American Community Survey. The votes went unanimously to Obama among the best-educated states and nearly unanimously to Romney in the worst-educated ones. (Nevada is the standout, but hey, they make a living playing the odds, which as Nate Silver showed, were in Obama’s favour.)
The data in the 24/7 Wall Street article doesn’t just list the percentage of the population with bachelor’s degrees or higher in the 10 best- and worst-educated states, it also has their median household income and the percentage of the population that lives below the poverty level. I took that data, put it in a table, and colour-coded it with the way each state voted in the recent election, and here it is:
| State | % w/ Bachelor’s Degree or Higher | Median Household Income | % Below Poverty Level |
|---|---|---|---|
| West Virginia | 18.5 | 38,482 | 18.6 |
| Mississippi | 19.8 | 36,919 | 22.6 |
| Arkansas | 20.3 | 38,758 | 19.5 |
| Kentucky | 21.1 | 41,141 | 19.1 |
| Louisiana | 21.1 | 41,734 | 20.4 |
| Alabama | 22.3 | 41,415 | 19 |
| Nevada | 22.5 | 48,927 | 15.9 |
| Indiana | 23.0 | 46,438 | 16.0 |
| Tennesee | 23.6 | 41,693 | 18.3 |
| Oklahoma | 23.8 | 43,225 | 17.2 |
| Minnesota | 32.4 | 56,954 | 11.9 |
| New York | 32.9 | 55,246 | 16 |
| New Hampshire | 33.4 | 62,647 | 8.8 |
| Virginia | 35.1 | 61,882 | 11.5 |
| New Jersey | 35.3 | 67,458 | 10.4 |
| Vermont | 35.4 | 52,776 | 11.5 |
| Connecticut | 36.2 | 65,753 | 10.9 |
| Colorado | 36.7 | 55,387 | 13.5 |
| Maryland | 36.9 | 70,004 | 10.1 |
| Massachusetts | 39.1 | 62,859 | 11.6 |
Once again, the pattern shows itself. You may want to keep this data handy the next time someone tries to sell you the malarkey that people who vote Democratic are low-achievers who just want handouts. The numbers show that they’re more likely to have gone to university, do better financially and less likely to be below the poverty line; it’s the opposite of the “window-licking layabout” stereotype of the Democratic voter that the Republicans tried to propagate.
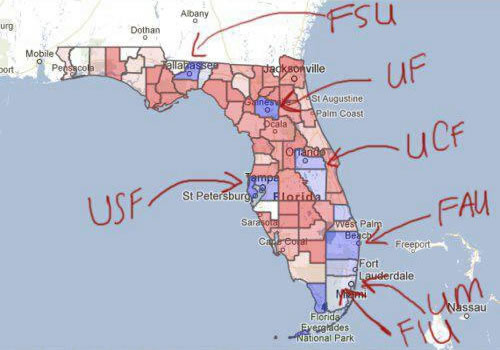
The pattern applies to regions smaller than states as well. Take Florida (please): this electoral map, courtesy of Unsettled Christianity, shows how various regions voted and where the state’s universities are. Note that the areas that voted blue were also those with the universities:
Table from Unsettled Christianity. Click to see the source.
So it turns out that in this one case, Karl Rove was right:
Our education plan allows us to make further gains in the suburbs. It will also allow us to make gains with Hispanics and African-Americans. As people do better, they start voting like Republicans — unless they have too much education and vote Democratic, which proves there can be too much of a good thing.
– Karl Rove in The Daily Texan, March 19, 2001


2 replies on “How the Best- and Worst-Educated Americans Voted”
“Preferential use of abstract analysis is often useful when dealing with
the many evolutionary novelties to be found in modernizing societies;
but is not usually useful for dealing with social and psychological
problems for which humans have evolved ‘domain-specific’ adaptive
behaviours. And since evolved common sense usually produces the right
answers in the social domain; this implies that, when it comes to
solving social problems, the most intelligent people are more likely
than those of average intelligence to have novel but silly ideas, and
therefore to believe and behave maladaptively.” – Bruce Charlton, Editor-in-Chief of the journal Medical Hypotheses.
[…] week I read about a trend in the results from the latest US election on Joey DeVilla’s blog (via HappyPlace, via Fox News, all ultimately via the US Census). Basically, the ten most educated […]